Part 1
Locating a Midaltitude Cyclone
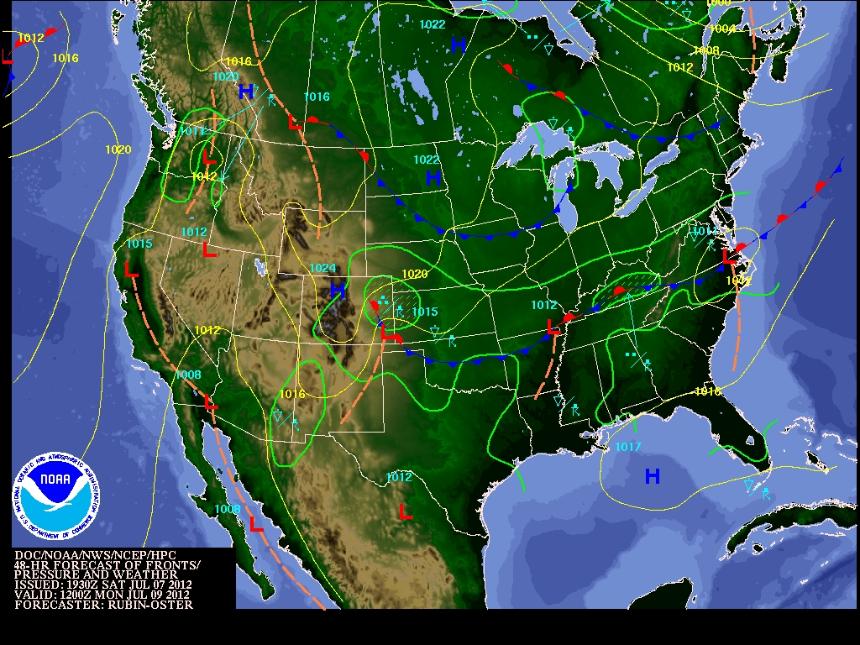
48 Hour Forecast
ISSUED SAT JUL 07 2012 1930Z
VALID MON JUL 09 2012 1200Z
Airport Weather 48 Hour Forecast for Bowling Green, Kentucky
Bowling Green - Warren County Regional Airport : KBWG
Analyze the weather map to determine the location of a midlatitude cyclone somewhere in the United States, which means a low pressure with weather fronts (i.e. cold fronts, warm fronts, and/or occluded fronts) associated with it.
I chose the low pressure stationary front that was forecasted for southern Kentucky. This means that gentle to moderate precipitation is forcasted in 48 hours.
Part 2
Verify the Weather Forecast
Monday, July 9, 2012
METAR and Current Weather Maps
| METAR text: | KBWG 091106Z AUTO 07003KT 1 1/4SM BR CLR 23/22 A2998 RMK AO2 |
| Conditions at: | KBWG (BOWLING GREE , KY, US) observed 1106 UTC 09 July 2012 |
| Temperature: | 23.0°C (73°F) |
| Dewpoint: | 22.0°C (72°F) [RH = 94%] |
| Pressure (altimeter): | 29.98 inches Hg (1015.3 mb) |
| Winds: | from the ENE (70 degrees) at 3 MPH (3 knots; 1.6 m/s) |
| Visibility: | 1.25 miles (2.01 km) |
| Ceiling: | at least 12,000 feet AGL |
| Clouds: | sky clear below 12,000 feet AGL |
| Weather: | BR (mist) |
Does the METAR data verify the 48 hour forecast?
I do think that the 48 hour forecast was correct. The staionary fron that was associated with the low pressure should produce precipitation, but not a full blown storm. THe METAR data shows the correct pressure that was predicted (1015.3 mb); light precipitation (mist) and low winds (3 MPH). All of these data would be assocoated with a low pressure stationary front.
Visible Map
Eastern United States
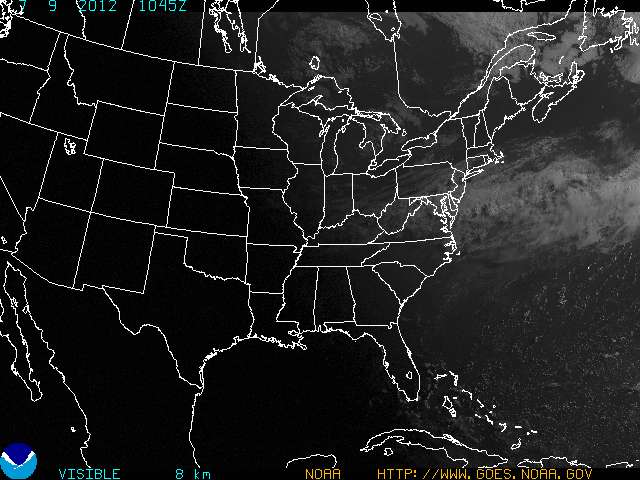
Was the 48 hour forecast correct?
The NOAA visible map doesn't show much going on in the Eastern United States or the Bowling Green, KY area. There is a bit of cloud cover, but I would have anticipated more cloud activity from the 48 hour forecast for the area. So I don't think the forecast was completely correct according to this map. It was correct for my airport in Bowling Green, KY, but I don't think there are enough clouds to account for the other low pressure cold front that was predicted for the midwest.
Color Enhanced Infrared Image
Eastern United States
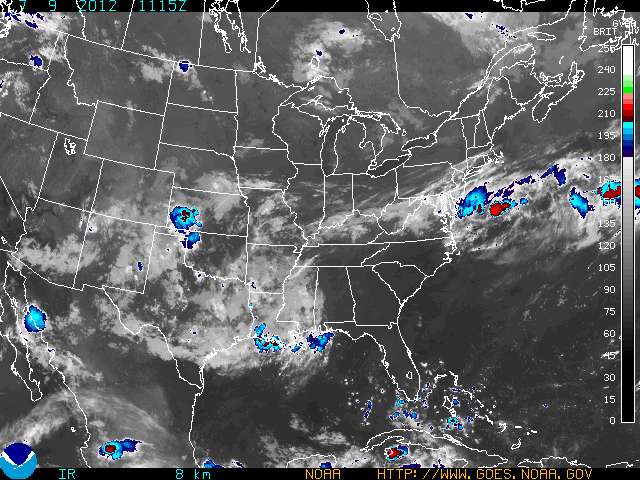
Was the 48 hour forecast correct?
When I looked at the visible map, it didn't look like there was much going on in the Bowling Green, KY area. I searched for other maps on the NOAA site and came across the infrared (IR) images that were color enhanced. This image gave me more visual information. Meteorologists use color enhanced imagery as an aid in satellite interpretation. The colors enable me to easily and quickly see features which weren't apparent in the visible map. In an infrared (IR) image cold clouds are high clouds, so the colors typically highlight the colder regions. This map did confirm the 48 hour forecast for light precipitation at the Bowling Green, KY airport.
Doppler Radar Image
South Central Kentucky
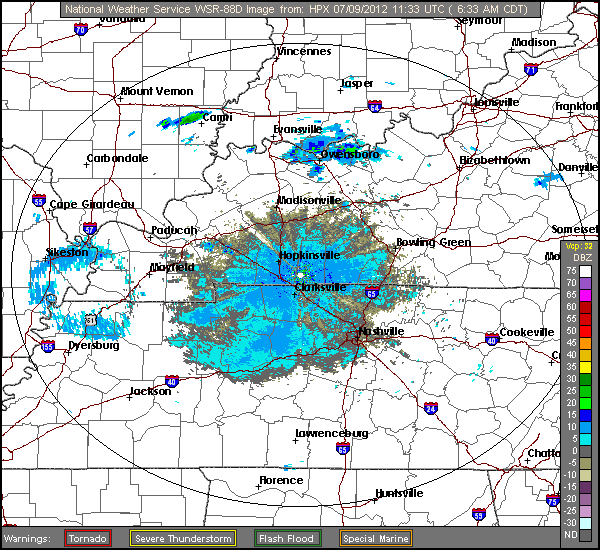
Was the 48 Hour Forecast Correct?
The doppler radar image shows light precipitattion just at Bowling Green, KY. This map confirms the METAR information that states that it was misting at Bowling Green. This also confirms that the 48 hour forecast for light to moderate precipitation is correct.
Upper Atmosphere Map
North America
This upper atmosphere map was obtained from the Department of Atmospheric Sciences at the University of Wyoming. The 500mb upper atmosphere map shows isobars just north of the Bowling Green Airport. It does not appear that Bowling Green is on the eastern edge of a trough. This would explain why a storm didn't develop from the low pressure stationary front that was forecasted.
Reflection
When I first read what was required for Assignment 3, I was overwhelmed. It seemed like there were lots of requirements. Interpretation of a 48 hour forecast, finding an airport that would be experiencing a low pressure system from the forecast, and making a link to my Yola website. Then I had to get up early on Monday morning to be ready to save all of the necessary tools and METAR data for the forecast. It took some figuring out, lots of web surfing and interpretation skills to put together this assignment. I'm glad I went through the process and I now have a greater understanding and appreciation for what meteorologists have to go through to make weather forecasts. I also realize that the science is not for sure every time. I guess I have always realized this because forecasts for our local weather here in Kanab are frequently wrong. It must be very exciting when a forecast is spot on, like the Salt Lake City forecast that our professor referenced for the assignment. The greater understanding I have about the weather and forecasting and the websites that are available to me, the more I will be able to make appropriate decisions about my outdoor activities. I enjoyed this assignment, it opened my eyes to weather forecasting and gave me some new tools that I can use to predict my own weather!